

When something occurs only once every 200 years, it is worth recording. When that something is as unpredictable as an extreme weather event, you need to collect as much data as possible and the record has to be accurate. Reputations of individuals and agencies hinge on it, future municipal planning depends on it.
That’s why universities, meteorological bureaus, and other agencies the world over turn to Campbell Scientific equipment when only reliable, accurate, meaningful data will do. And it is precisely why the aftermath of 1998’s Cyclone Sid near Townsville, Australia is remembered as more than just a once-in-a-lifetime storm. On January 10th, 1998 Cyclone Sid crossed the coast 50 miles north of Townsville.
Sid was a slow-moving, Category 1 cyclone which resulted in little wind damage. Once inland however, it formed into a rain depression and saturated Townsville and surrounding areas. In one night, more than 650 mm (25.6 inches) of rain fell on the region. The level of Townsville’s Ross River Dam (capacity of 214,000 megalitres or 56,500 million gallons) rose from 72 percent capacity to 2.5 meters (8.2 feet) over the spillway wall in little more than a day. It was easy to say it was an historic event, but could it be proved?
Just over 12 months prior to Cyclone Sid’s arrival, the local council made the decision to purchase an automatic weather station to monitor evaporation rates and water temperature of the dam. The Townsville region has annual evaporation rates of around 2.5 meters (8.2 feet) per year and measurement is critical in managing the city’s water supply, particularly when supply levels are reduced. Water temperature profile measurements were also required to assist water supply engineers in detecting temperature inversions which can lead to algal blooms.
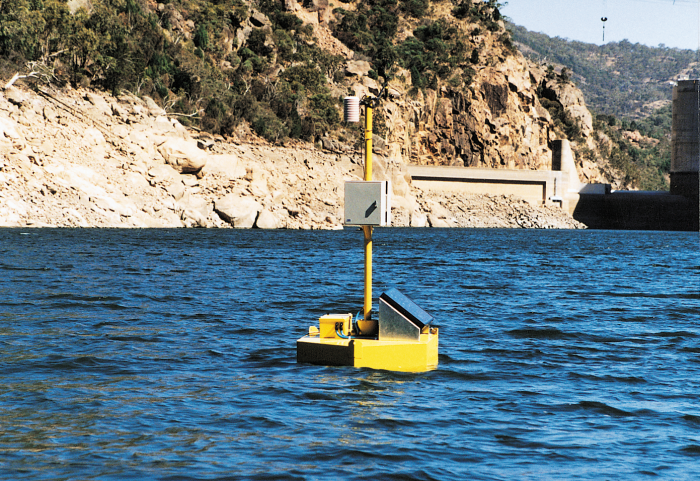
Campbell Scientific Australia and the New South Wales Department of Land and Water Conservation worked together to design, supply and install a buoymounted automatic weather station capable of measuring wind speed and direction, humidity, solar radiation, rainfall and air and water temperatures. The weather station was mounted on a 3-meter mast above a buoy with thermistors mounted on a chain trailing down to 12 meters below the surface. A voice-synthesized modem with cellphone was installed to provide both voice and computer access to the floating station. Twelve months worth of data was routinely collected before the "main event" arrived.
By 8 p.m. on the night of Saturday January 10th, rain was falling at a rate of 100 mm (4 inches) per hour, gradually decreasing through 7 a.m. the next morning. Despite being severely buffeted by wind and torrential rain for several hours, the CR10X laboriously collected what was soon to become historic data. Two days after the flood, heavy cellphone usage and extensive cloud cover resulted in the battery supply voltage falling below the 12 volt minimum required to power the cellphone and communications were lost until sufficient sunlight returned. The CR10X datalogger however, maintained a continuous data record throughout, and after the critical event.
Cyclone Sid was recorded for posterity—a 200 year average recurrence storm event, now an invaluable source of knowledge for present and future planning.
Inside the Measurements Down Under
The floating weather station on Ross River Dam is anchored to the reservoir bed by a system of counterweights and pulleys, creating a fixed lateral position while still allowing buoyancy. Even in heavy waves, the mast remains vertical thanks to a gimbal block attachment to the buoy. Beneath the surface, a thermistor chain is suspended from the buoy to measure temperatures at depths to 12 meters. Above-buoy instrumentation includes a Campbell Scientific CR10X datalogger which records and stores raw data and is programmed to calculate evaporation rates as well. Data retrieval is accomplished via cellular telephone, live in real time, through a voice synthesizer, or by downloading directly to council offices. Once the data are stored, displays of three-dimensional graphs can be created using CSI’s RTDM software.
Sumário de Estudos de Caso
Aplicação
Buoy-based meteorological and hydrological monitoringLocalização
Ross River Dam near Townsville, AustraliaProdutos Utilizados
CR10XOrganizações Participantes
New South Wales Department of Land & Water ConservationParâmetros de Medição
Wind speed and direction, humidity, air temperature, water temperature at multiple depths, solar radiation, rainfallVer o PDF